Individual Student Report (ISR) Setup
For each program, you can set up one or multiple Individual Student Reports on the ISR Settings tab of the Program Configuration page (under Test Management). Reasons to create multiple ISRs might be to support multiple languages or to split out subjects if desired. An ISR cannot include results from tests across multiple programs.
End users can access the ISR report from the Performance Report. When a user selects a single student from the Performance Report to launch their individual ISR, a modal to select which ISR report to use is presented to the user if multiples are available. Users can switch between the report options and the ISR will render inside the modal and once the Print button is selected, it will launch the browser's print popup.
NOTE: You must first finalize the main Program Configuration before setting up an ISR. See: Program Configuration.
ISR Settings
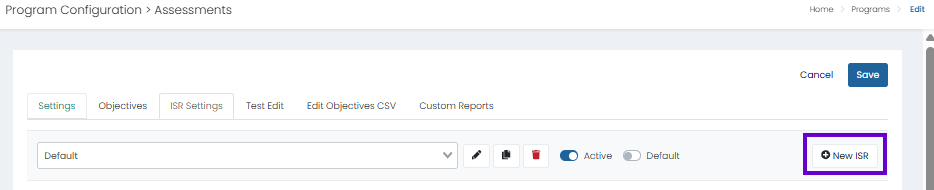
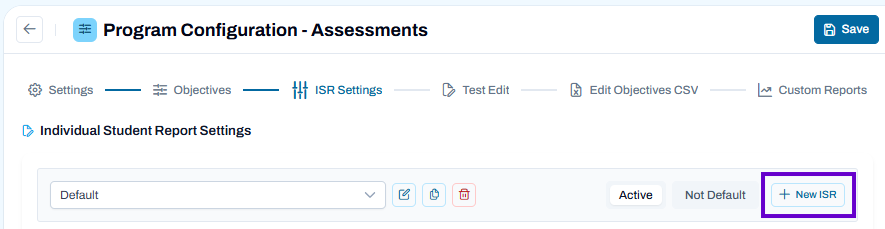
Follow instructions from Program Configuration, select your program and navigate to the ISR Settings tab. If multiple ISRs are set up, select one from the menu.
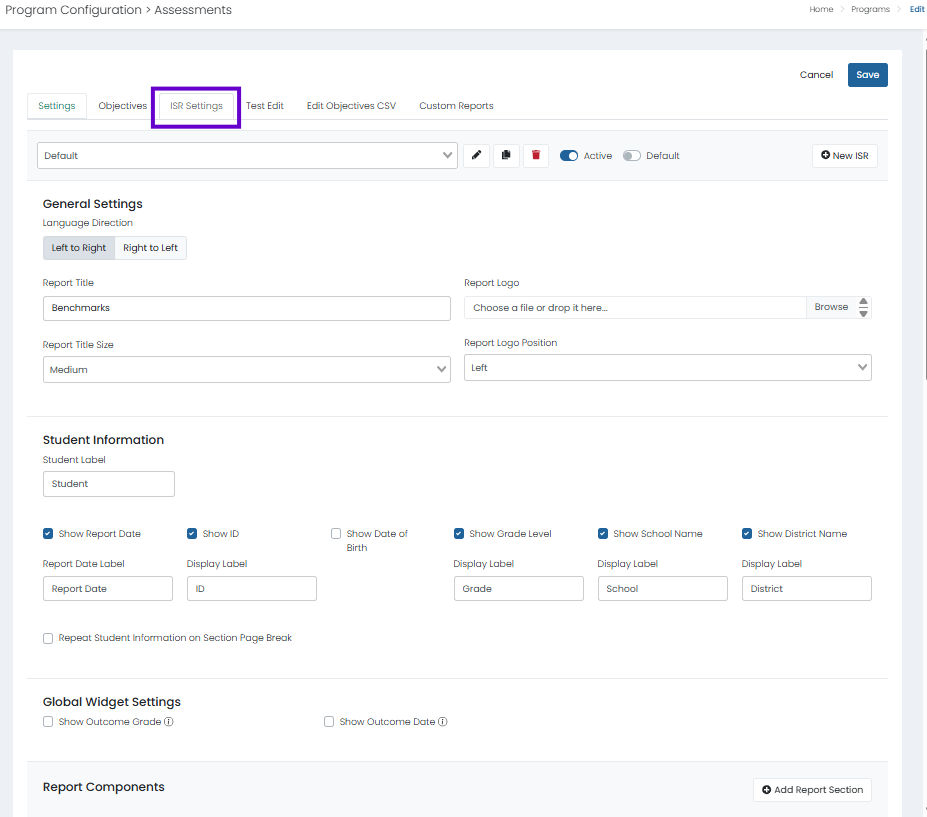
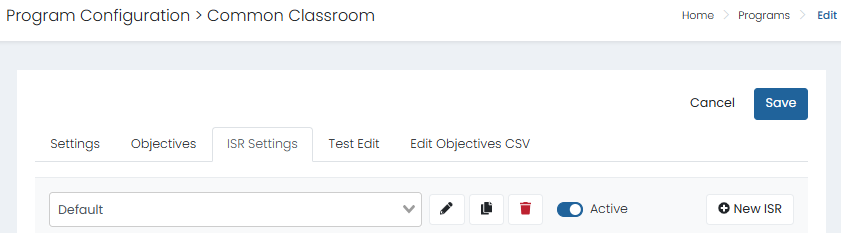
Classic User Interface:
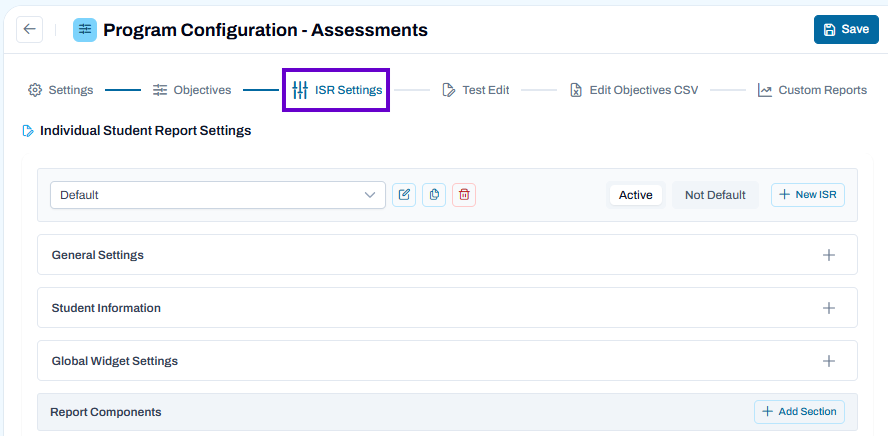
Updated User Interface:
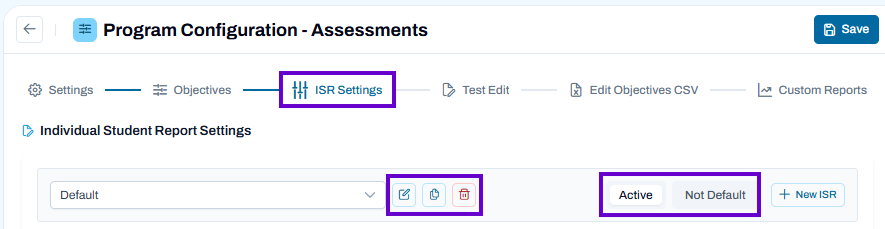
For the selected ISR, you can:
- Edit the ISR Name
- Duplicate the ISR
- Delete the ISR
- Activate/Deactivate the ISR. If marked inactive, the option will not be presented to users in the selection modal after selecting a single student from the performance report.
- Set an ISR version as Default (for example, for the English version).
- Make edits to the settings and select Save.
Classic User Interface:
Updated User Interface:
Create a New ISR
Select the New ISR button. In the popup window, enter a an ISR Name and then select Create ISR. The new name will appear in the menu. Choose settings as described below and select Save periodically. If the site is already in use, consider making the ISR inactive until it is fully built.
Classic User Interface:
Updated User Interface:
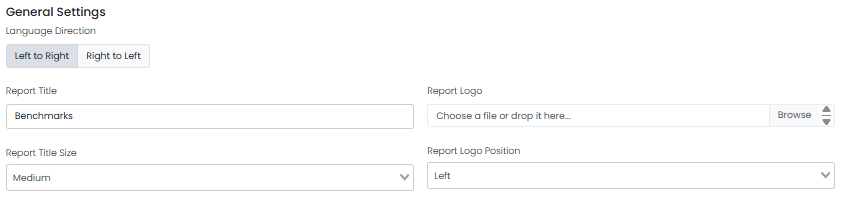
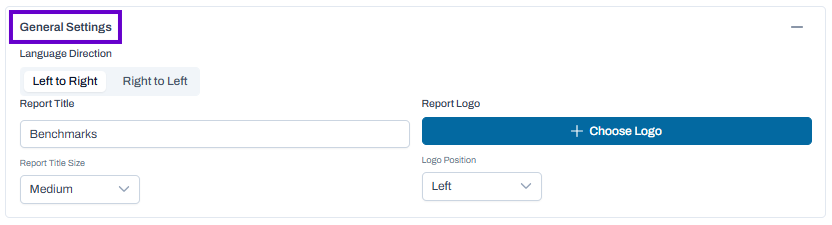
General Settings
Language Direction: Indicate the language direction for the ISR display.
Report Title: Enter a name for the report, and underneath, also the Report Title Size.
Report Logo: Optional. Select a logo by browsing or drag and drop a file. JPG, PNG, and GIF are supported. Underneath, select the Report Logo Position.
Classic User Interface:
Updated User Interface:
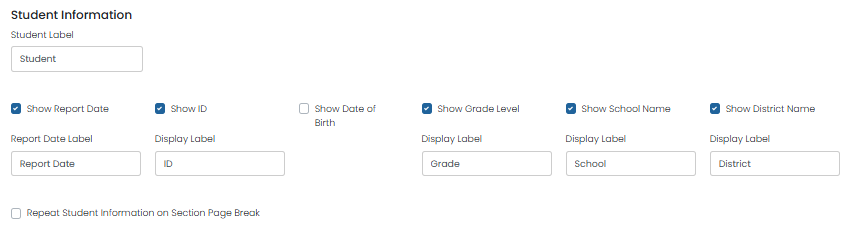
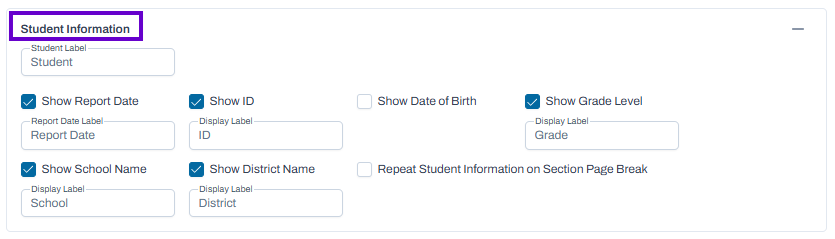
Student Information
Select which fields to include. Optionally, add a custom label; these are typically used for foreign language versions.
- Student Label: Required.
- Show Report Date: Display the report date on the report.
- Report Date Label
- Show ID: Display the student ID on the report.
- Display Label
- Show Date of Birth: Display the student's date of birth on the report.
- Show Grade Level: Display the student's grade level on the report.
- Display Label
- Show School Name: Display the student's school name on the report.
- Display Label
- Show District Name: Display the student's district on the report.
- Display Label
- Repeat Student Information on Section Page Break
Classic User Interface:
Updated User Interface:
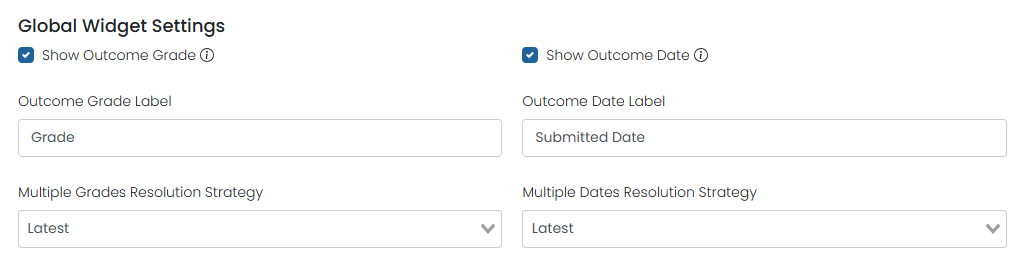
Global Widget Settings
This feature allows for customization of the labels that appear across all widgets instead of using one set of "Grade" and "Submitted Date" labels on all ISR versions. Users can override the labels (ex. translations for languages by version) using the Show Outcome Grade and Show Outcome Date fields. Additionally, apply logic to which grade and date appears when there are multiple available.
Classic User Interface:

Updated User Interface:

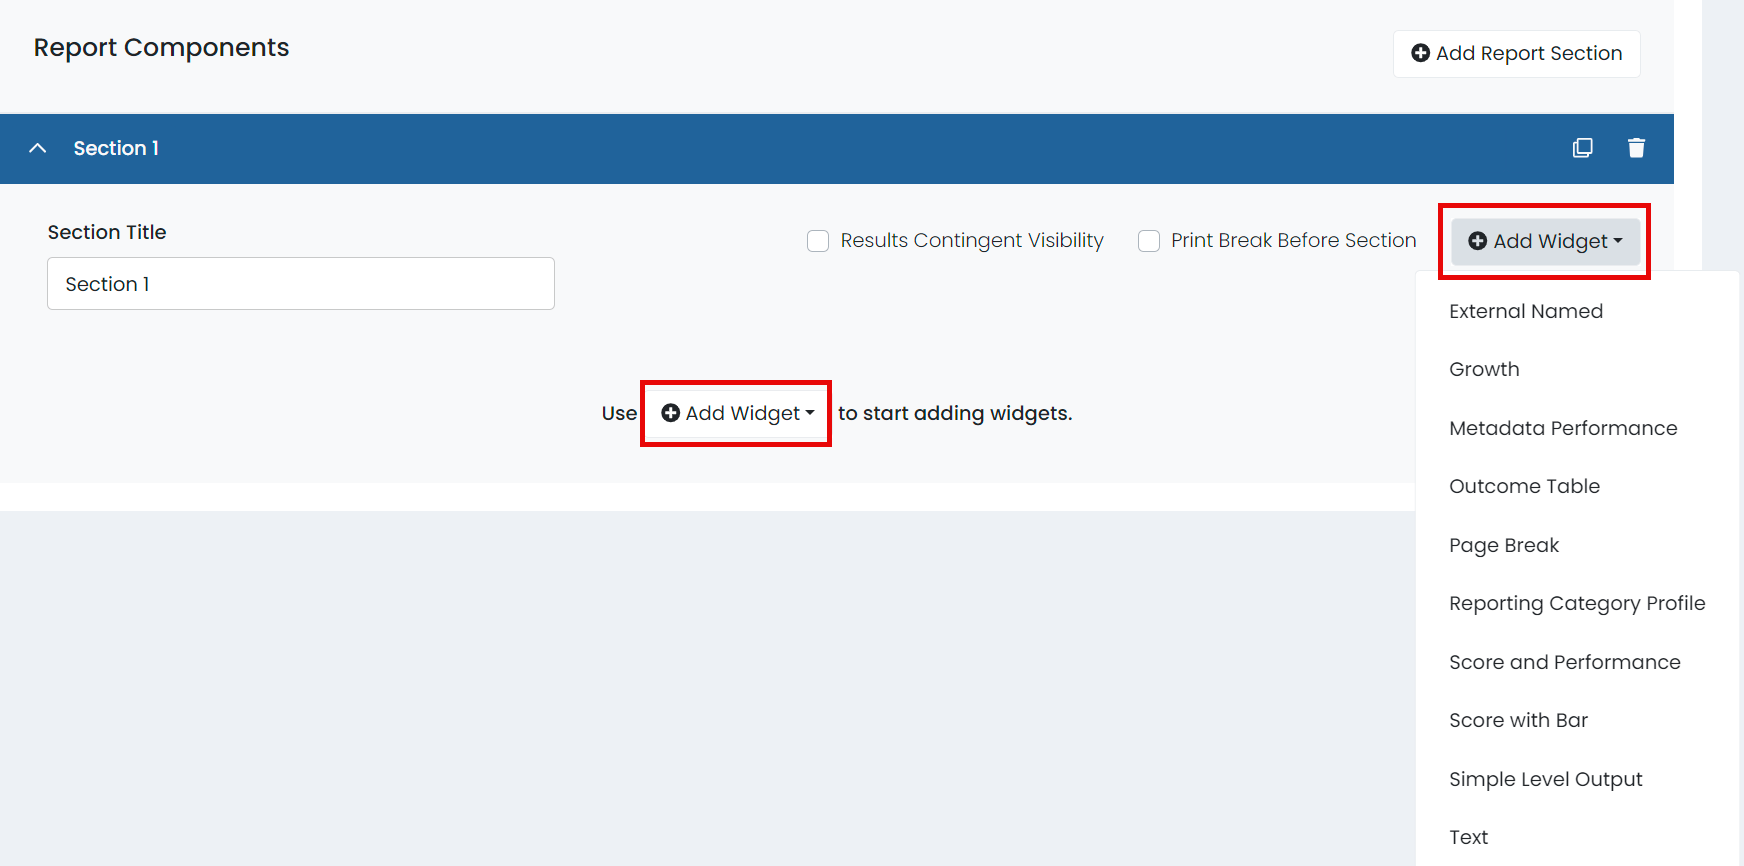
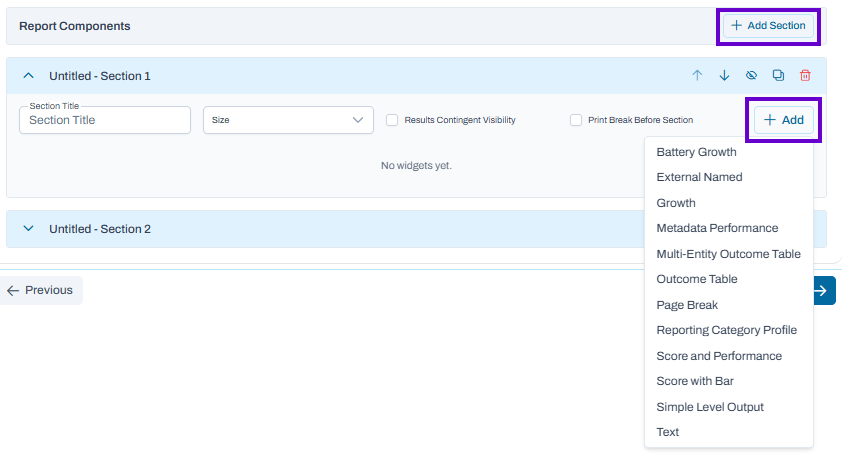
Report Components
After defining the general settings, you can select and configure each section you want to include on the individual student report. Each section can contain multiple widgets with specified performance objectives. Report widgets will not appear on the ISR when there is no data for the student (except for Text, which is not dependent on student data).
- Add Report Section: Select to add a report section. Each section may contain one or more widgets.
- Section Title: Enter a name for the report section.
- Results Contingent Visibility: Controls whether a report component is shown only when specified result conditions or data criteria are met.
- Print Break Before Section: Insert a page break before the section.
- Add Widget: Select to add a report component to a section. You can add several report components to a section. For each widget, select a single Content Area, one or more Test Windows, and an Objective (database field).
Classic User Interface:
Updated User Interface:
Note: If data does not exist for an ISR component that is defined, it will not appear on the report.
You can add the following report components to the ISR:
- Battery Growth: Used only for programs utilizing Battery testing. Consult program delivery team for additional information.
- External Named: Only supports external data from TestNav. The External Objective is from TestNav data, such as scaled score.
- Growth: Shows a graph with performance over time. For performance levels, score groups appear as background colors on the chart. Supports both ADAM and external data from TestNav.
- Metadata Performance: Similar to the Growth report but using a grouping of items, such as reading comprehension or writing ability. Supports ADAM data only.
- Multi-Entity Outcome Table: Use to display both proficiency level and scale score across multiple outcomes. This widget option allows outcomes for domain name, proficiency level, and scale score display. Scale score display is further configurable with number of ticks, starting value, and ending value.
- Outcome Table: Only supports external data from TestNav populated based on Content Area, Test Window, and (optionally) Grade. You can build a table with up to two data columns and as many rows as needed. The left column is for the row description, and the two data columns allow you to select performance objectives defined in the program or manually entered objective keys (for example REPORTING_CATEGORY_PERCENT_CORRECT). Select Add Text to a table description or legend.
- Page Break: Insert a page break at the selected location (anywhere within a section). You can also select the Print Break Before Section checkbox.
- Reporting Category Profile: Select the Content Area and add Reporting Category Keys (reporting category code) to display a table with reporting categories.
- Score and Performance: Shows the scaled score and a bar with colors for each performance level. Select the checkboxes to show test information, score group summary statements, and school and district averages. Also allows ISR display options to be configured. Supports ADAM data only.
- Score with Bar: Only supports external data from TestNav. Similar to the Score and Performance component but with an objective from TestNav data.
- Simple Level Output: Select a Performance Level Objective. Supports ADAM data only.
- Text: Use this component to share text information, including links. Enter a heading and text or links in the content area.