Performance Report
Available tabs within this report can vary by grade, depending on your program.
The Performance Report shows student performance within organizations and classes for a single test. The test must be assigned to a program in order to generate a Performance Report. This report is only available to roles with permission to view it, such as district and school administrators. The report is updated in real time.
Step-by-Step
- Select Reporting, and then select Performance.
- Select a Program.
- Click anywhere in a test row to open the Performance Report.
You can interact with the report as described below.
The Performance Summary tab is always available and provides a performance overview across all organizations you have access to. This tab shows Progress (scoring complete), Proficiency*, and the performance objectives defined by your program. In the Scope column, you can drill down to specific institutions and classes. For each class, you can also open the Class Administration Report and Class Program Report.
*Proficiency will not appear if no score groups are designated as proficient in the Program settings.
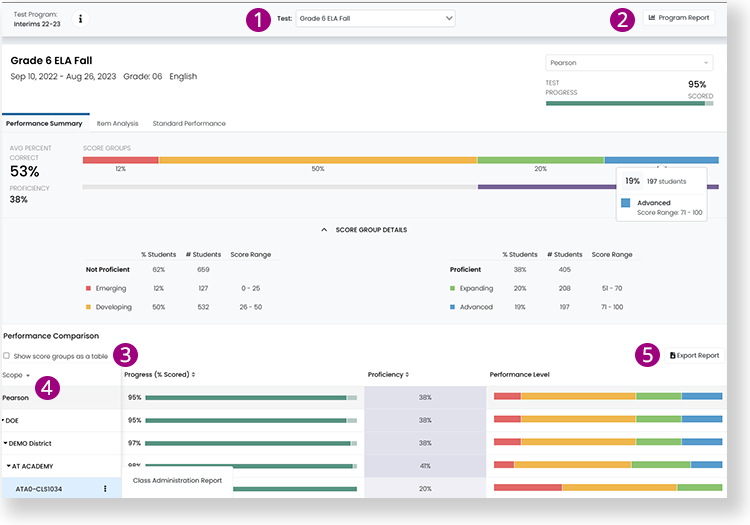
You can perform the following actions on the Performance Summary tab:
- Test dropdown: Select a different test to view.
- Program Report button opens the Program Report.
- Select the Show score groups as a table checkbox to show the Performance Level column as a table.
- This checkbox is only available when using Performance Level in the program.
- Scope picker: Select an organization to filter the report by. In the dropdown, select an arrow to expand the list of child organizations. At the class level, select the more menu (
 ) to open additional reports.
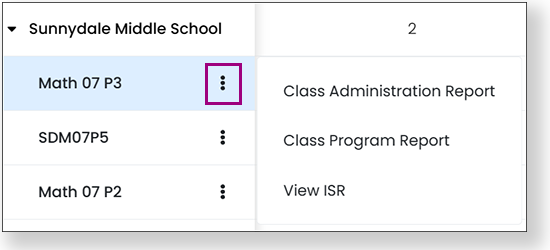
- Class Administration Report: This report is the same as a teacher's Class Test Report. View student progress and performance for the selected organization, as well as student responses, item analysis, and standard performance if these are included in the program for that grade.
- Class Program Report: View student progress and results for all administrations in the program. You can search and filter the results.
- View ISR: View the Individual Student Results (ISR) report. This report is configured in program setup and can be modified at any time. There are several components that can be included in the report, such as Growth, Score and Performance, Outcome Table, and external data from TestNav.
- Select the Export Report button to export the report as a CSV file.
- Lexile and Quantile Scores: If available, the Quantile (or Lexile for Reading) column pulls that score from the student's ISR and displays it within the student's row.
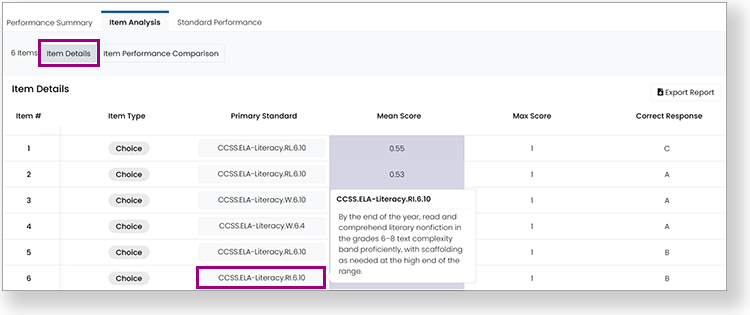
The Item Analysis tab shows Item Details and provides an Item Performance Comparison. This tab is only available if the program is set up to use it.
Item Details
This section lists the items on the test with information about the item, including the primary standard, mean score, max score, and correct response. Hover over a standard to see a full description.
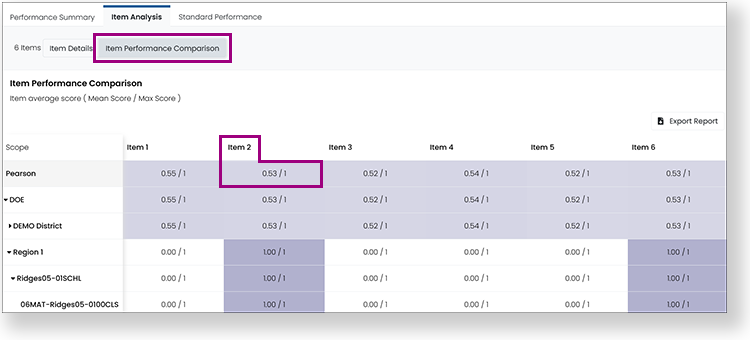
Item Performance Comparison
This section shows performance on each item across institutions and classes.
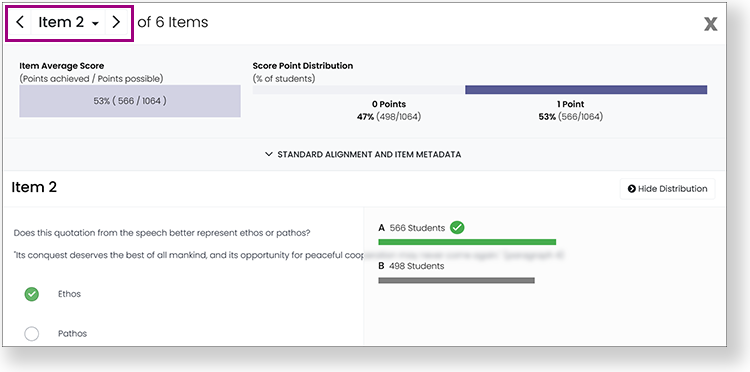
In both the Item Analysis sections, you can select an item number or an item cell to open a popup that shows item content, answers, average score, and score point distribution.
At the top of the popup, you can select the arrows or item dropdown to view other items in the report.
The Standard Performance tab shows Standard Details and a Standard Performance Comparison. This tab is only available if the program is set up to use it.
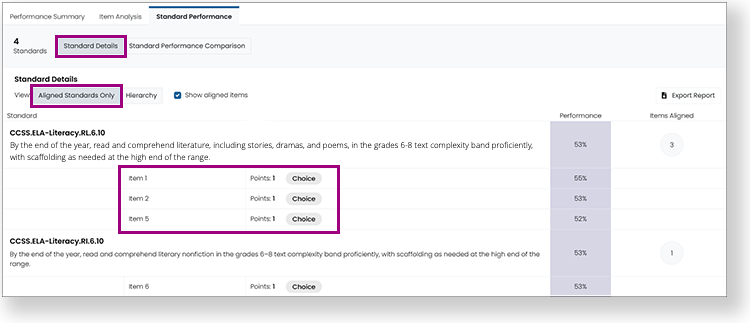
Standard Details
The Standard Details section lists the aligned standards as well as performance on the standard and the number of items aligned. When the Show aligned items, you see a list of aligned items beneath each standard.
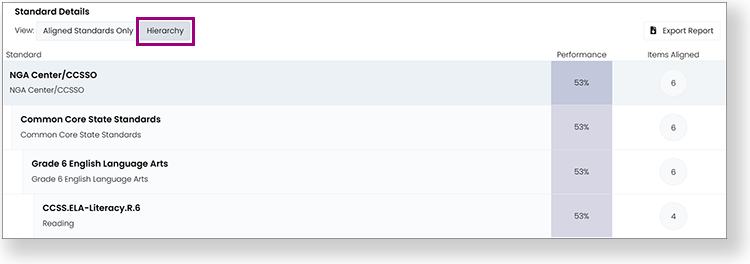
Toggle to the Hierarchy section to view a hierarchical list of the standards and performance on those standards.
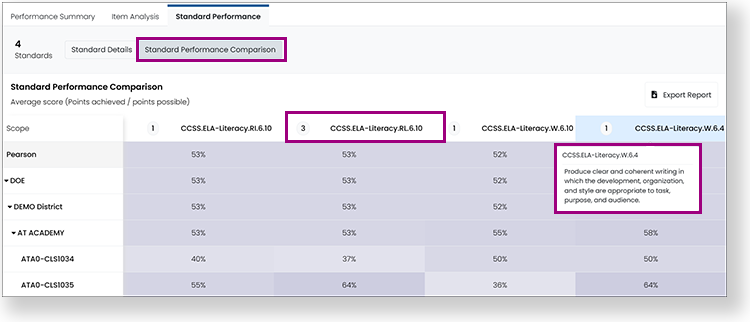
Standard Performance Comparison
The Standard Performance Comparison section shows performance on each standard in institutions and classes. You can hover over a column header to see the full standard description. The number in the column header indicates the number of items aligned to the standard.
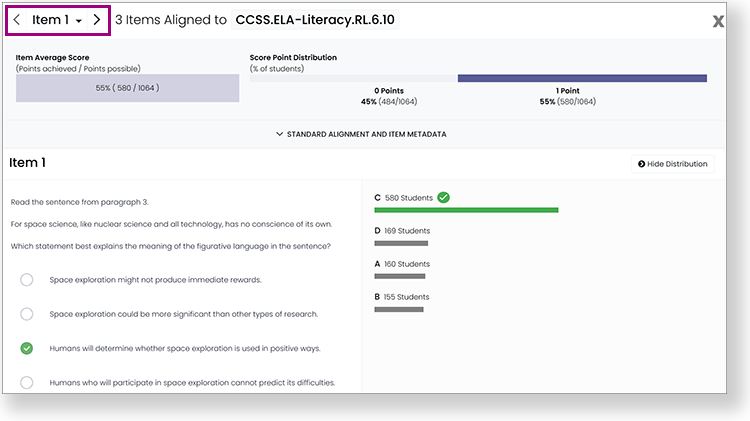
In both sections under the Standard Performance tab, you can select any standard in the table to open a popup that shows details about items aligned to the standard. Select the arrows or item dropdown to view other items in the report.
Configuring the Performance Report
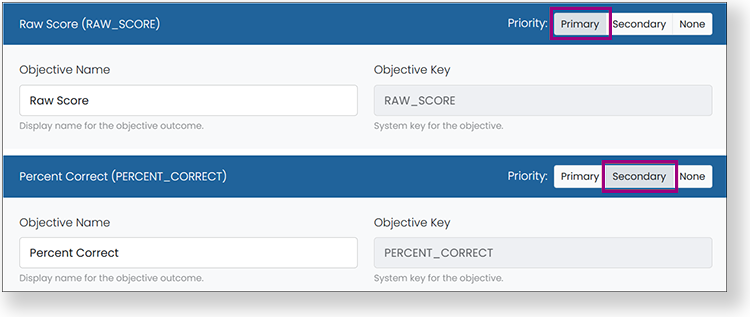
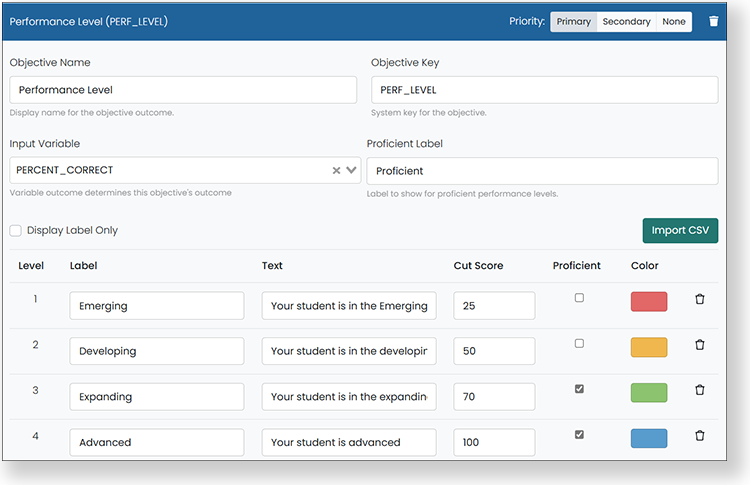
The Performance Report is highly configurable, so the examples here may not match what you see in your system. The report shows one primary objective and (optionally) one secondary objective. The primary objective is the main focus and is emphasized on the report. The secondary objective is also visible but not as prominent.
Example of Performance Level as primary objective in Program Configuration (used in examples below).
Example of primary and secondary objectives.