The Program Report provides an overview of student performance for all (or selected) tests and test windows in a program. This report is available to roles with permission to view it, such as district and school administrators.
Access the Program Report
- Select Reporting > Performance.
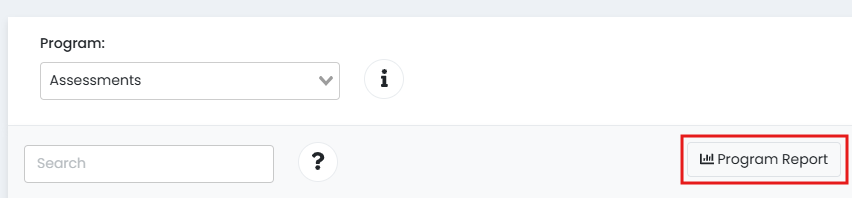
- Select a Program.
- Select the Program Report button.
View the Program Report
You can configure the report in several ways. Available filtering options and actions can vary, depending on your program.
- Scope: Select an institution. Inside the dropdown, select an arrow to expand the list of child institutions. Only the institutions you have access to appear.
- Grades: Add or remove grade level filters. This is the grade level assigned to the tests, not the students. By default, all grades are selected.
- Content Areas: Add or remove content area filters.
- Test Windows: Add or remove test window filters.
- Administration: Add or remove specific test administrations. This is a filter only, not a column in the report.
- Show score groups as a table: Select the checkbox to show the Performance Level column as a table. This checkbox is only available if Performance Level is used in the program.
- Export Report: Select the button to export the report as a CSV file.
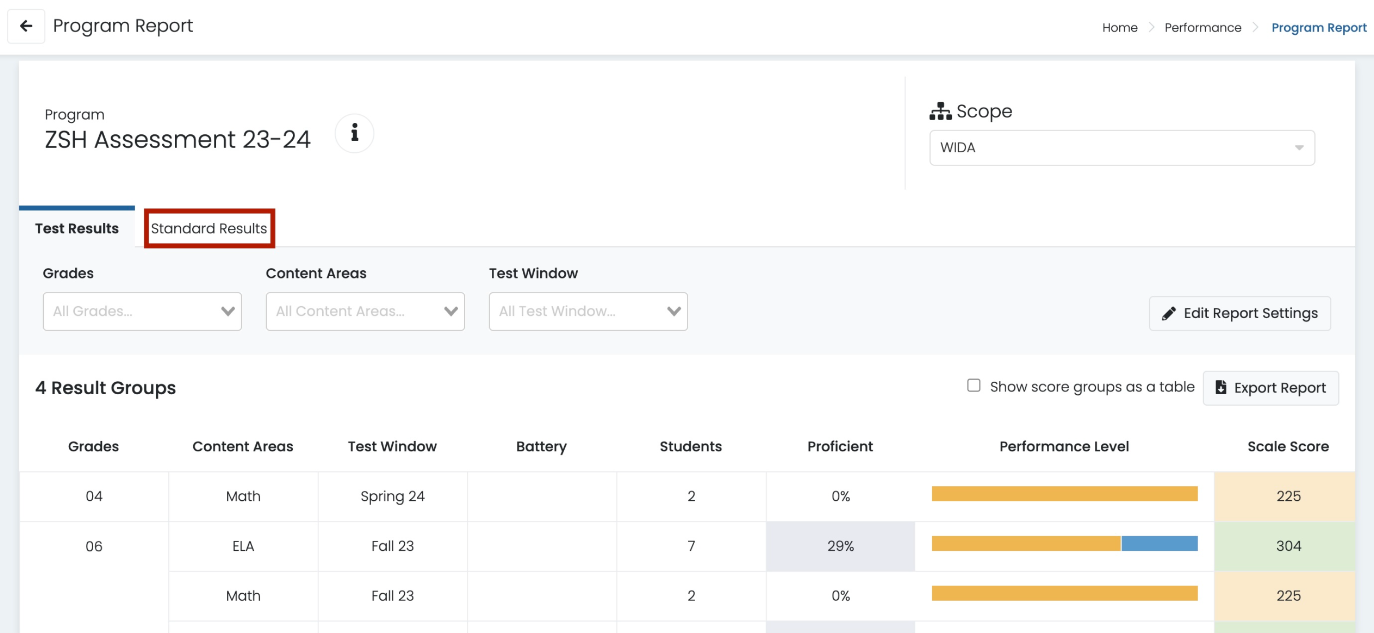
Sample Program Report. You may see different performance metrics depending on how the program is set up. This example shows the Scale Score and Performance Level. You may see different columns, such as Percent Correct.
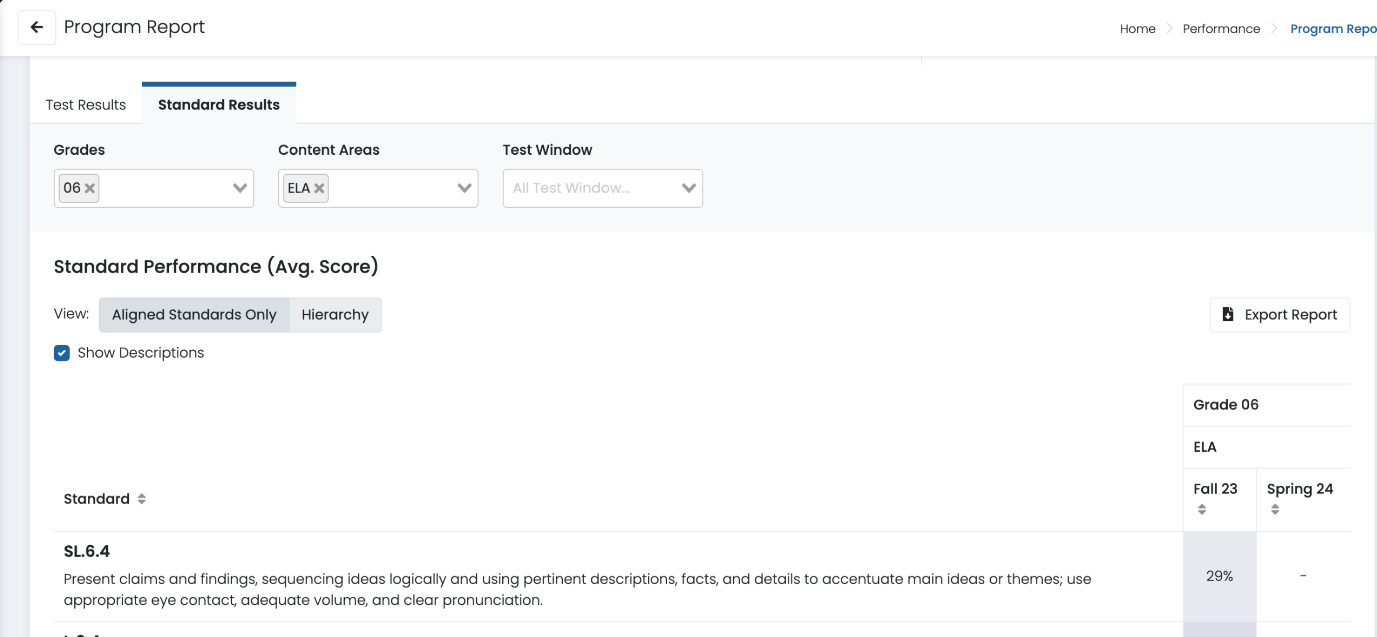
Sample Standards Results view
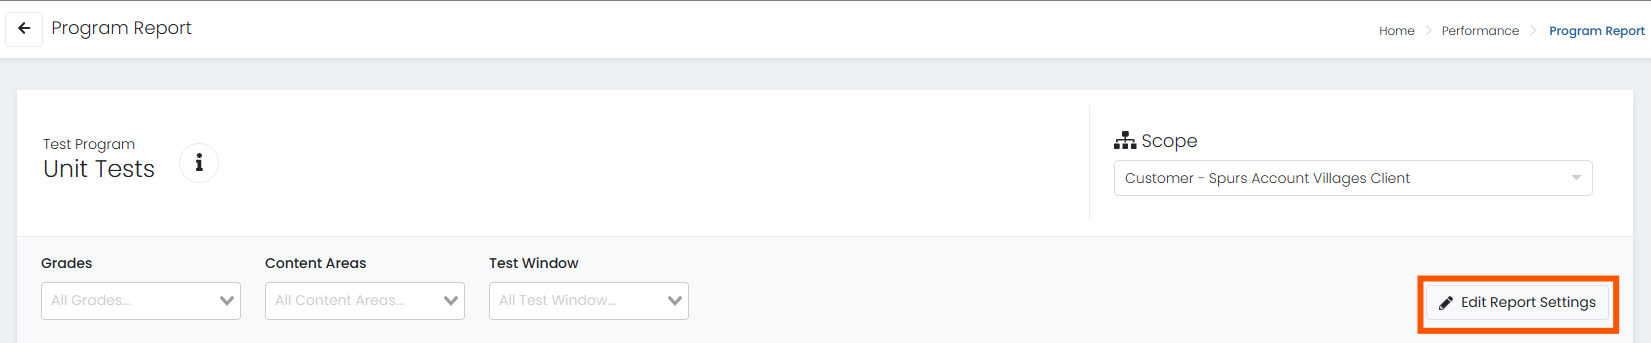
Modify Reporting Settings
If your program is configured to allow it, you can select Edit Report Settings to modify report settings.
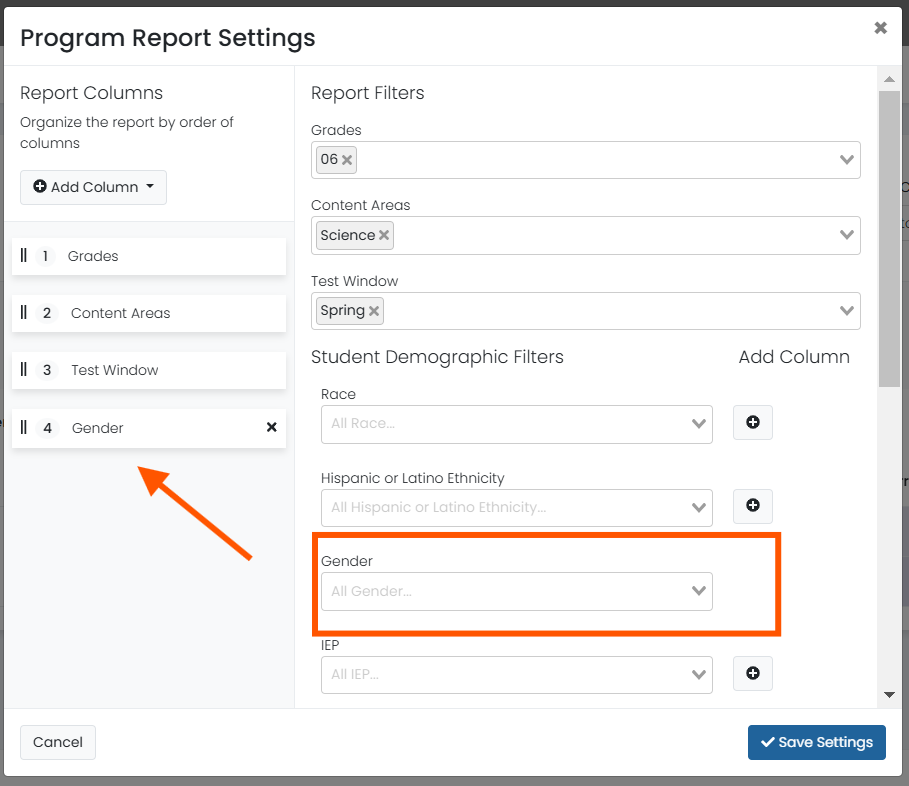
Options available in Report Settings:
- Reorder Columns: Drag and drop the column headers to change their position.
- Report Filters: Filter by Grades, Content Areas, or Test Windows. You can select multiple values for each filter. These filters can also be applied on the main report page.
- Student Demographic Filters: If available in your system, filter by Race, Hispanic or Latino Ethnicity, or Gender. You can select multiple values for each filter. Select the plus icon to add a filter as a report column.
- Add Column: Add a new column, such as Race or Gender.
Tiny Link: https://support.assessment.pearson.com/x/YwUgBg