For navigation instructions, see Access Transcend Reports.
The STATUS AND GROWTH REPORT shows a single student's scores on a test. This includes the overall score, domain scores, and performance levels.
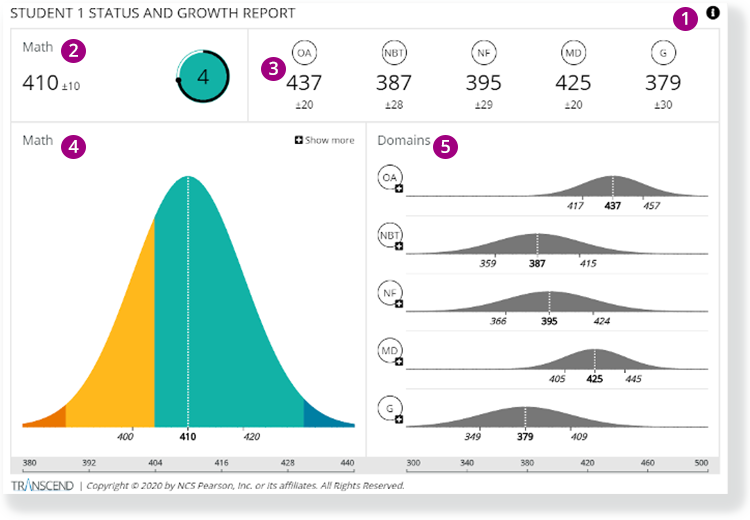
1 - Click the info icon on the right to expose info icons on the report. Click those to view details on each report element.
2 - The overall subject score indicates the student's score and standard error of measure* on the single test in that subject. The circular chart color represents the student's estimated performance level, surrounded with a confidence band.
- When a student is placed in the lowest performance level, the confidence band around the circle reflects the likelihood that the student is placed in the lowest performance level.
- When the performance level is one other than the lowest performance level, the confidence band around the circle represents the likelihood that the student is placed in that performance level or above it.
3 - These numbers indicate the student's score and standard error of measure for each of the domains.
on the overall score or one of the domain scores to compare this test with earlier tests to show the student's growth.
4 - The chart indicates the student's subject-level score and standard error of measure on this single test.
- The color bands represent the different performance levels.
- Click Show more (and then Show less) to toggle between the latest test and all tests.
5 - Charts in the Domains section indicate the student's score and standard error of measure for each of the domains on this specific test.
You can click on a domain to see charts for the previous assessments for that domain.
* For example, wer, 420-400.