...
- The horizontal axis indicates the score, and the vertical axis indicates the number of students who received that score.
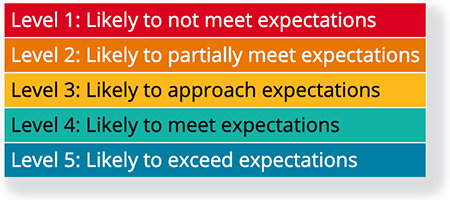
- The color bands represent the different performance levels.
- Click Show more (and then Show less) to toggle between the latest test and all tests.
| Digi Accordion | ||
|---|---|---|
| ||
|
6 - Charts in the Domains section show the distribution of the students' domain-level scores on the current test.
- The horizontal axis indicates the score, and the vertical axis indicates the number of students who got that score.
- Click on a domain to see charts for the previous assessments for that domain.