...
- You can click the grade (3, in this example) to see the subgroups of that grade (for example, schools in the district, or classes in the school).
- You can click details to go to the STATUS AND GROWTH SUMMARY REPORT for that grade.
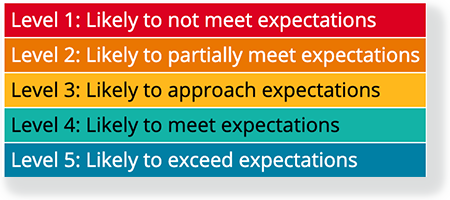
3 - The Performance Levels by Grade graph includes Performance Level colors that represent each earned performance level and the percentage of students that performed at that level.
| Digi Accordion | ||
|---|---|---|
| ||
|
...