...
You can click arrows at the top of any column to sort that column.
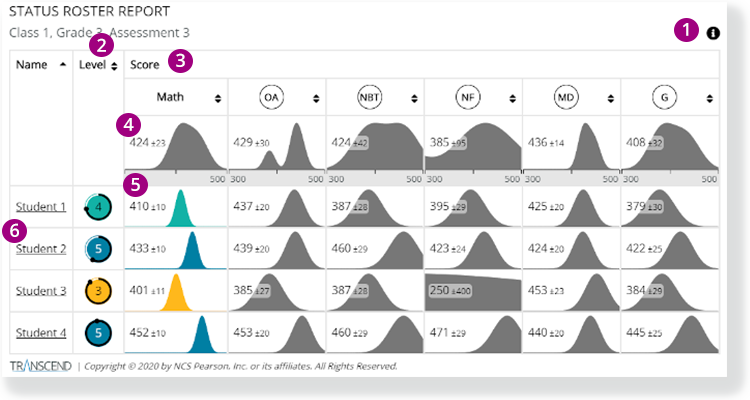
1 - Click the info icon on the right to display info icons on the report. Click those to view details on each report element.
2 - The Level column indicates the estimated performance level for each student in that subject. The circular chart color represents the student's estimated performance level, surrounded with a confidence band.
...