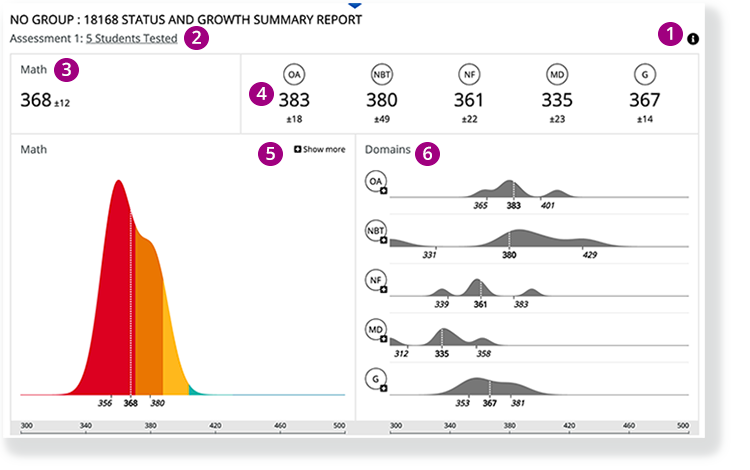
The Status and Growth Summary Report displays the overall score and the domain scores for a group of students on a test.
1 - Click the info icon on the right to expose info icons on the report. Click those to view details on each report element.
2 - The number of students appears below the main heading. You can click the number of students to open the STATUS ROSTER REPORT for this group of students.
3 - Click the overall score to compare it with previous tests to analyze the group's growth.
4 - Click each of the domain scores to compare them with previous tests to analyze the group's growth.
5 - The chart shows the distribution of student scores on this particular test.
- The horizontal axis indicates the score, and the vertical axis indicates the number of students who received that score.
- The color bands represent the different performance levels.
- Click Show more (and then Show less) to toggle between the latest test and all tests.
6 - Charts in the Domains section show the distribution of the students' domain-level scores on the current test.
- The horizontal axis indicates the score, and the vertical axis indicates the number of students who got that score.
- Click on a domain to see charts for the previous assessments for that domain.