Accessing reports - Teachers/Proctors
Teachers and proctors with login credentials can access reports specific to their classes and test administrations. The most common reports for teachers/proctors to access are class Class and Test Reports, Individual Student Reports (ISRs), and Performance Reports.
Class and Test Reports, and the ISR
Class and Test Reports list each student in the teacher's class, their test progress, and if complete, their scale scores on each test that the student took.
Step-by-Step
- After you log in to ADAM, you should see My Classes. If not, select My Classes from the main navigation menu.
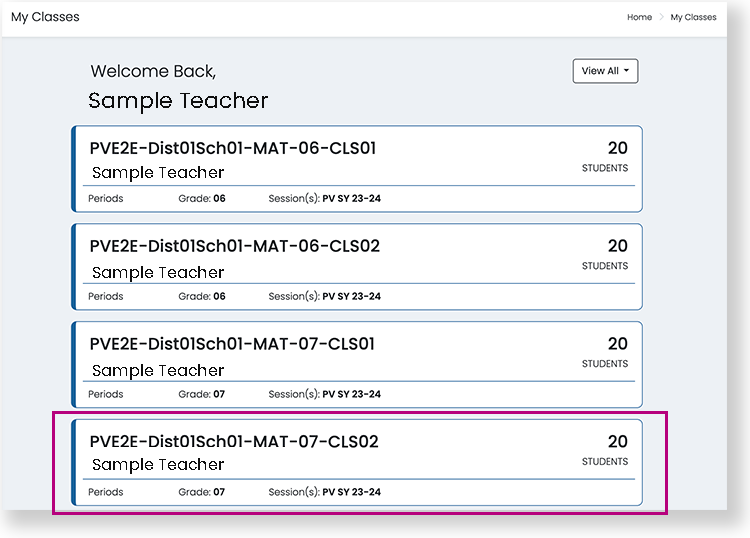
- Select a class whose reports you want to view.
- View reports.
The Class Report opens displaying test and student roster information. See callouts in the image below.
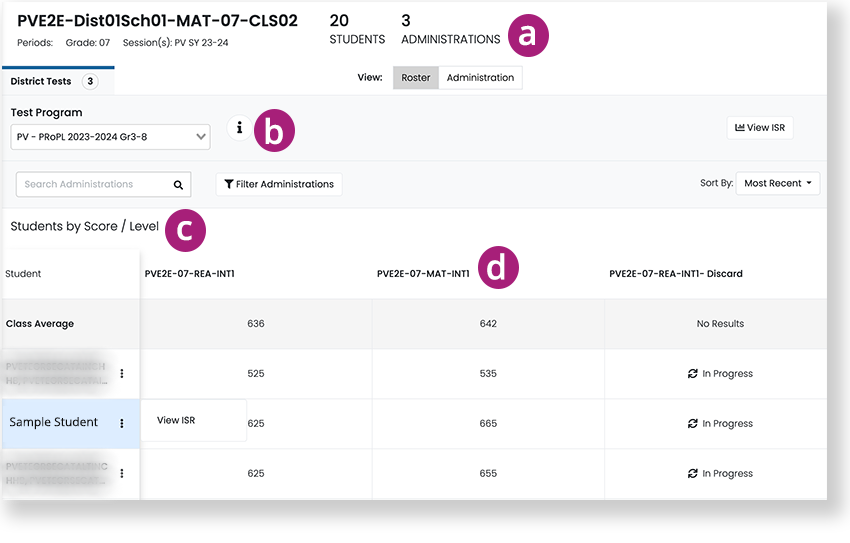
a - The header contains details about the class - the class name, periods, grade, and session, as well as the number of students and test administrations. Roster is selected by default. You can toggle between the Roster or Administration to view administration information.
b - If the class participates in more than one Test Program, you can select the dropdown to select a different program. You can also search and filter administrations to narrow your results.
c - The student list follows a row for the Class Average. Next to each student name, you can select the More icon to select ISR to view that report for each student.
d - Each row contains data for each test administration. Columns with completed administrations contain scores and columns for incomplete administrations contain information on the progress of each student test.
You can click on the test administration name to open a detailed Test Report. See next tab.The Test Report opens displaying test and student roster information. See callouts in the image below.
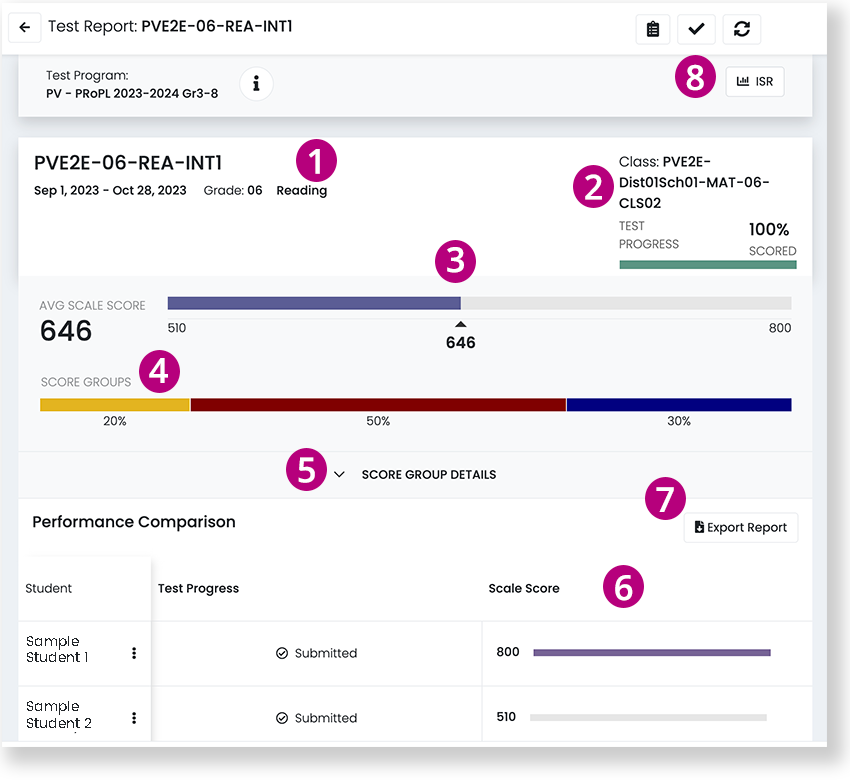
1 - Test information appears in the header.
2 - Class information appears to the right.
3 - The AVE SCALE SCORE bar graph gives a visual representation of the average scale score.
4 - The SCORE GROUPS bar graph visually displays the percentages of students in each score group.
5 - You can select to expand SCORE GROUP DETAILS (info below).
6 - The Scale Score column displays each student's scale score.
7 - You can select Export Report to export a PDF of this report.
8 - You can select ISR to open the ISR page beginning with the first student in the list. A dropdown appears at the top of that page for you to select each student to view their ISRs. For more info, see the ISR tab.
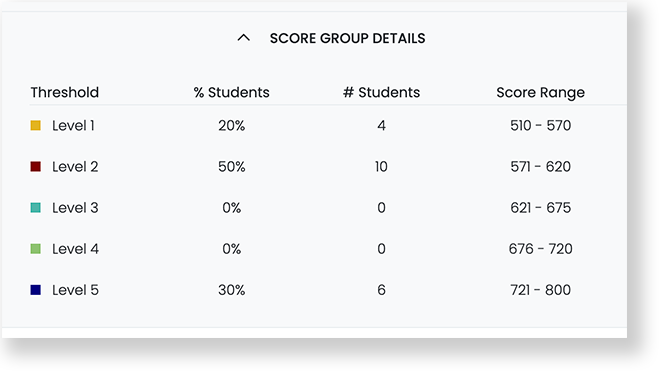
When you expand SCORE GROUP DETAILS, you can see performance levels in the Threshold column, the percentage and number of students in each threshold, and the score range for each level.
When you select ISR from either the student list or the ISR header button on either the Class or Test Report page, the ISR opens displaying student test information. Teachers view all subjects for students in their classes, even if they did not administer all tests.
See callouts in the image below. Click to enlarge.
ISR Reading Overview
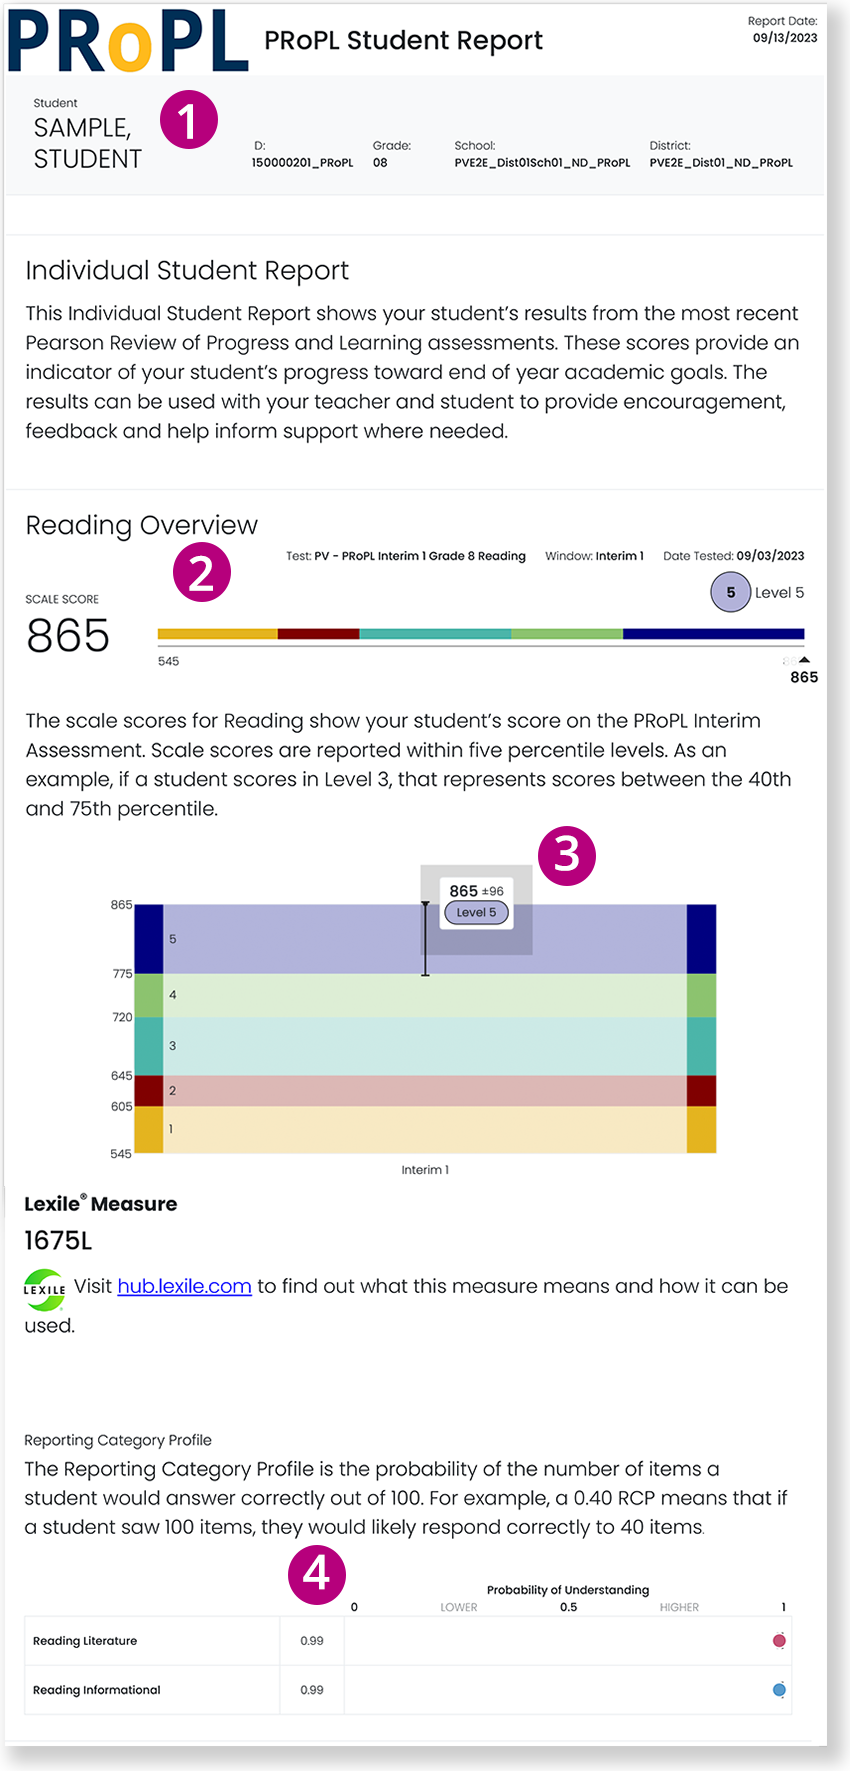
1 - Student information appears at the top of the report.
2 - Below the report description, the student's Reading scores are detailed with visuals and an explanation of their scores.
3 - The bar graph below provides a visual representation of where the student's score lands within the threshold levels.
4 - The Reading Overview also contains information on Lexile Measure and a Reporting Category Profile that explains the student's probability of understanding the various types of questions within different Reading categories.
When you select ISR from either the student list or the ISR header button on either the Class or Test Report page, the ISR opens displaying student test information. After you scroll through the Reading section, the Mathematics section follows.
Teachers view all subjects for students in their classes, even if they did not administer all tests.
See callouts in the image below. Click to enlarge.
ISR (con'd) - Mathematics Overview
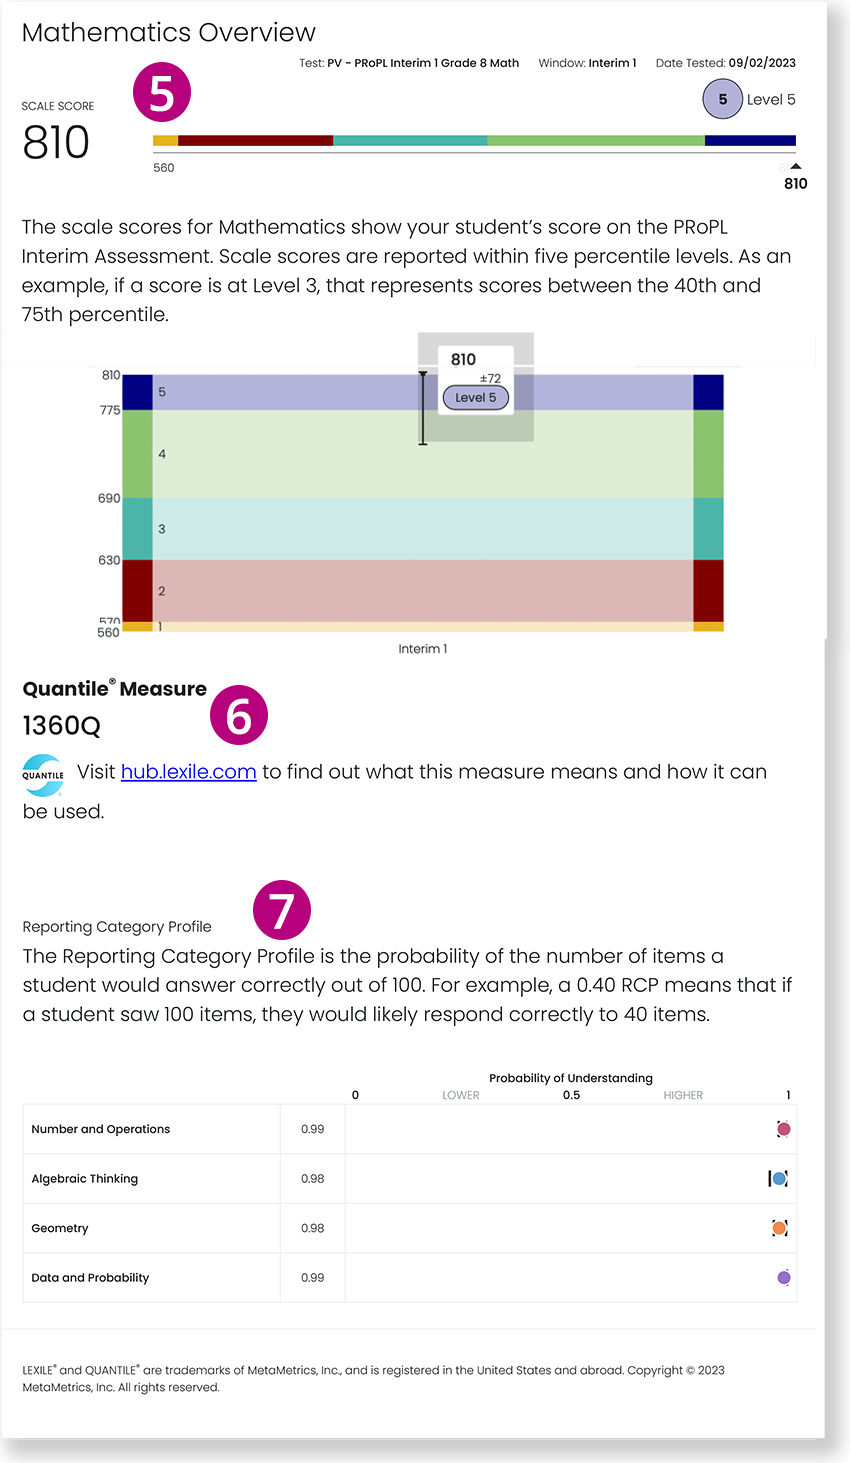
5 - The student's Math scores are detailed with visuals and an explanation of their scores. The bar graphs provide a visual representation of where the student's score lands within the threshold levels.
6 - The Mathematics Overview also contains information on Quantile Measure and a Reporting Category Profile that explains the student's probability of understanding the various types of questions within different Math categories.
Performance Reports
Performance Reports provide much of the same information as the Class and Test Reports with some additional specifics within the Performance Comparison.
Step-by-Step
To access Performance Reports:
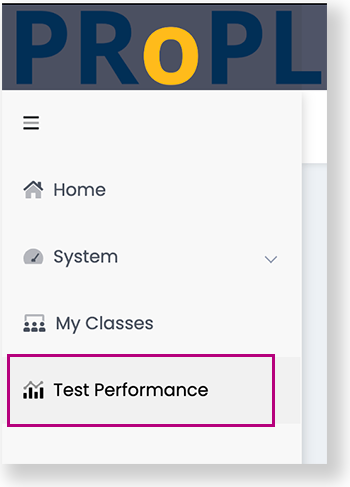
- Select Test Performance from the main navigation.
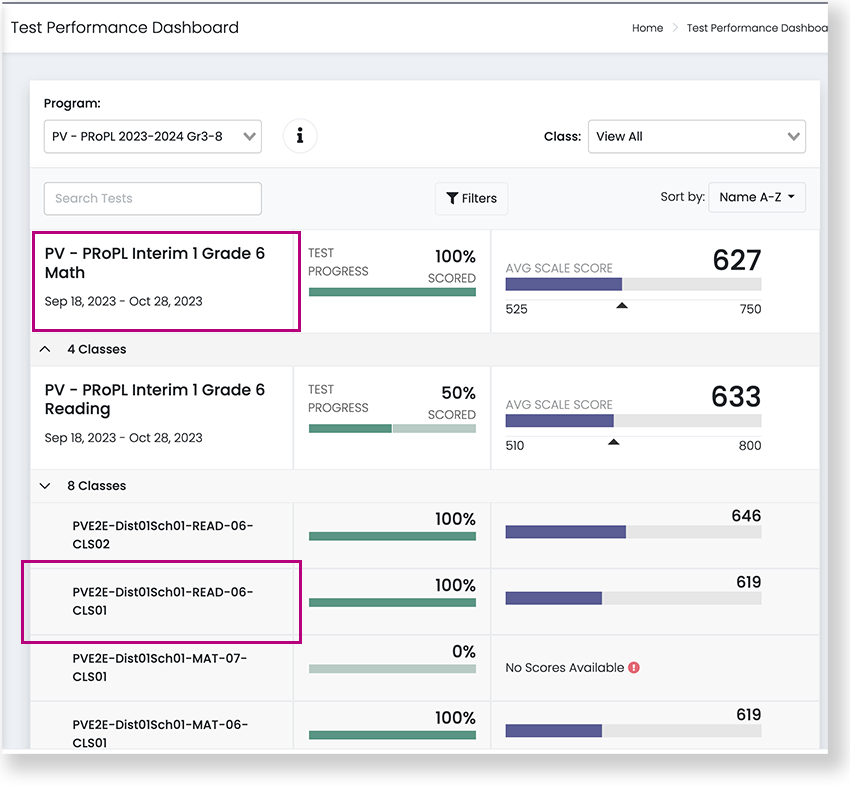
- Select a test administration or a class within the administration dropdown for tests administered to multiple classes. The Test Performance Dashboard lists TEST PROGRESS and AVE SCALE SCORE, just like the Class and Test Reports.
The Performance Report appears with the same information on Test Progress and Scale Scores as the previous reports, with two additional columns.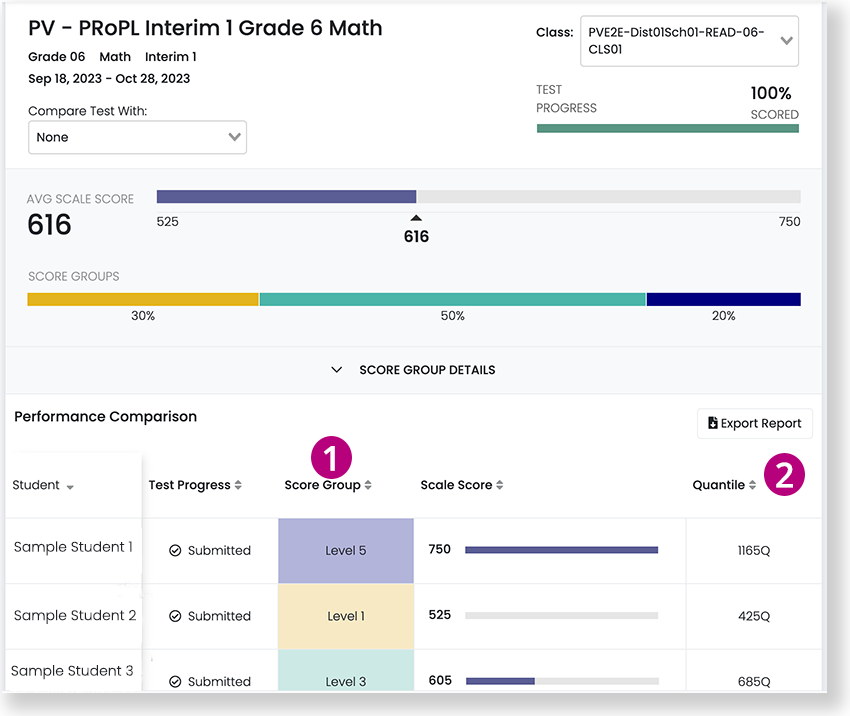
1 - The Score Group column pulls the level threshold from the SCORE GROUP DETAILS section into the student's row.
2 - The Quantile (or Lexile for Reading) column pulls that score from the student's ISR and displays it within the student's row.