For navigation instructions, see Access Transcend Reports.
The STATUS AND GROWTH REPORT shows a single student's scores on a test. This includes the overall score, domain scores, and performance levels. 1 - Click the info icon on the right to expose info icons on the report. Click those to view details on each report element. 2 - The overall subject score indicates the student's score and standard error of measure* on the single test in that subject. The circular chart color represents the student's estimated performance level, surrounded with a confidence band. 3 - These numbers indicate the student's score and standard error of measure for each of the domains. You can click the + (plus) on the overall score or one of the domain scores to compare this test with earlier tests to show the student's growth. 4 - The chart indicates the student's subject-level score and standard error of measure on this single test. 5 - Charts in the Domains section indicate the student's score and standard error of measure for each of the domains on this specific test. You can click on a domain to see charts for the previous assessments for that domain. * For example, the Math overall score of 410 has the possibility of being either 10 points higher or lower, 420-400.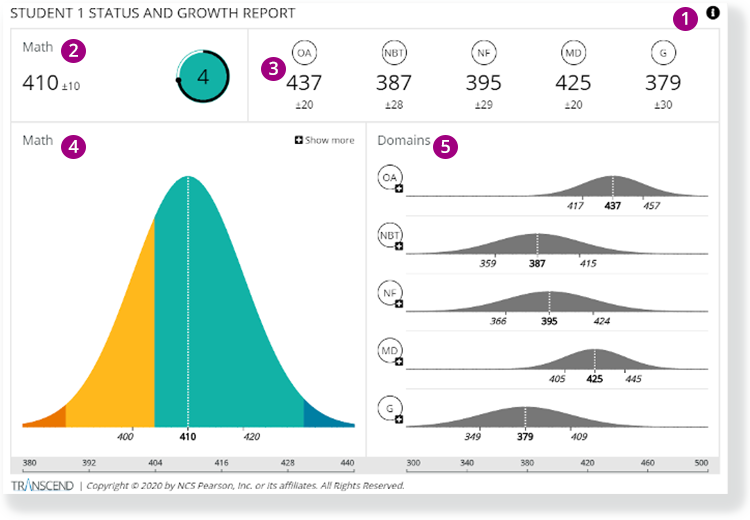
![]() You can click Download Report to download a PDF version of the report. You can also click the back button above to go back to the online version of the report.
You can click Download Report to download a PDF version of the report. You can also click the back button above to go back to the online version of the report.