For navigation instructions, see Access Transcend Reports.
The STATUS ROSTER REPORT shows a group of students' estimated performance on a single test. This includes the subject-area and domain scale scores, and standard deviations.
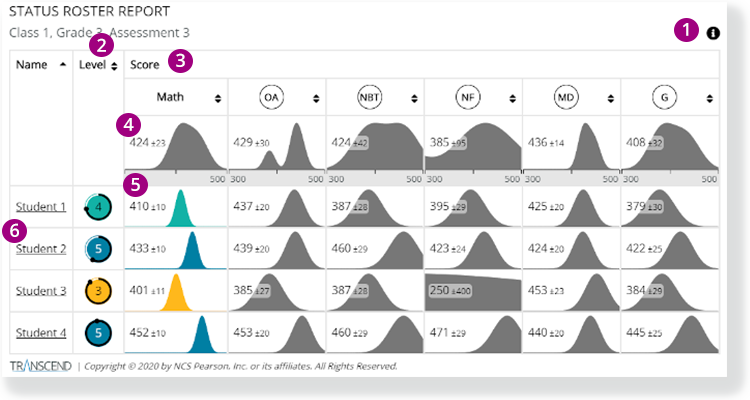
1 - Click the info icon on the right to display info icons on the report. Click those to view details on each report element.
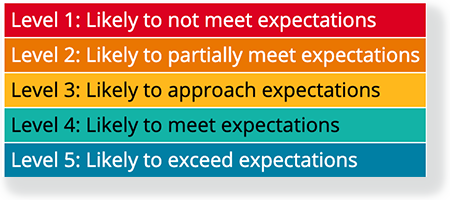
2 - The Level column indicates the estimated performance level for each student in that subject.
+
View Performance Level color legend...
3 - The Score section contains
- Numbers that reflect the mean and standard deviation of the students' scores for the subject and each of its domains (for example, above, the Math overall score of 424+/-23 means that the scores can range from 447 to 401).
- Charts that show the distribution of the students' scores.
- The horizontal axis indicates the score, and the vertical axis indicates the number of students who received that score.
4 - The information in the first cell of each Score column summarizes the entire group of students.
5 - Student rows show the individual students' scores overall and in each domain.
6 - Click a student name to go to that student's STATUS AND GROWTH REPORT.