For navigation instructions, see Access Transcend Reports.
The STATUS ROSTER REPORT shows a group of students' estimated performance on a single test. This includes the subject-area and domain scale scores, and standard deviations.
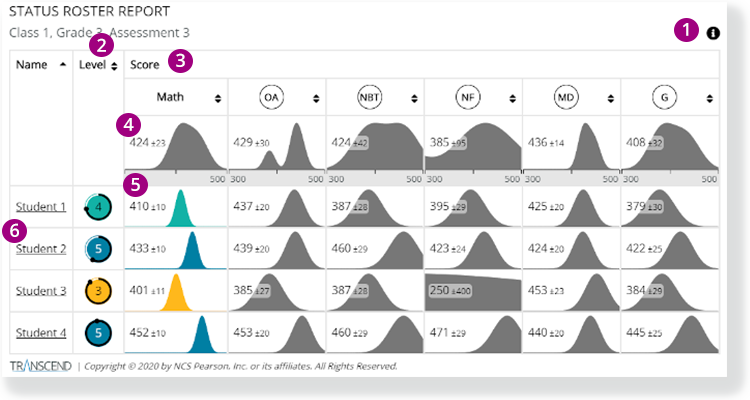
1 - Click the info icon on the right to display info icons on the report. Click those to view details on each report element.
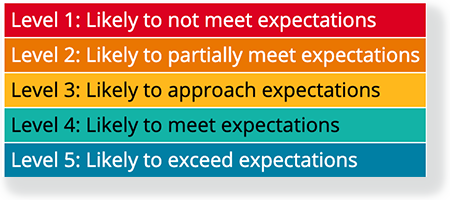
2 - The Level column indicates the estimated performance level for each student in that subject.
3 - The Score section contains numbers that reflect the mean and standard deviation of the students' scores for the subject and each of its domains (for example, above, the Math overall score of 424+/-23 means that the scores can range from 447 to 401).
- The chart shows the distribution of the students' scores.
- The horizontal axis indicates the score, and the vertical axis indicates the number of students who received that score.
4 - The information in the first cell of each Score column summarizes the entire group of students.
5 - Student rows show the individual students' scores overall and in each domain.
6 - Click a student name to go to that student's STATUS AND GROWTH REPORT.