In the Bar Chart interaction, the student responds by dragging bars on a bar graph to the correct locations. One or more bars can be set to a fixed height. It allows authors to create vertical and horizontal bar charts. Authors can add a prompt, set the grid coordinates, add labels, bars and bar groups. This is a machine scored interaction.
See Author Test Items and Choice Interaction for general instruction on item creation.
To create a bar chart interaction:
- From the Editor tab, select Add Interaction > Charts & Graphs > Bar Chart.
- Enter a prompt.
- Grid Settings are used to set up the bar graph:
- Optionally modify the Chart Label to add a bar graph title
- X and Y Labels: Add labels for the axes.
- Enter the Min and Max values. Enter the minimum number and maximum number to be labeled on the axis with numbers (y-axis for vertical bars or x-axis for horizontal bars). You can show an origin that is not (0,0). Both origins will show if they are different values on the x and y axis, but only one shows if the value is the same.
- Visual Increment defaults to 1 but may be adjusted. This is the scale for the numbers labeled on the axis.
- The Snap-to Increment does not have to match the visual increment shown on the chart axis.
- Optionally, change to a horizontal Orientation.
- Unchecking Show Origin will remove the label on the Min value (initial line).
- In the Bars section, use the Add Bar (Plus) icon to add additional bars. Each bar that is added should have a field to add the bar “Label”.
- For each bar, provide a Label for each bar, as well as a Start and Correct Value. To include a bar with a fixed value that students will not adjust, select 'Static'; the Correct Value is grayed out as it is not applicable.
- The scoring is set in the Preview section by entering the correct height of each bar in the Correct Value fields.
- For Scoring Settings, enter the value of the item. Partial scoring is not available for this item type.
- Enter Properties. See also Item Properties.
- Select Save.
- Select Preview.
- Toggle on 'Show Answers' and confirm it works as expected.
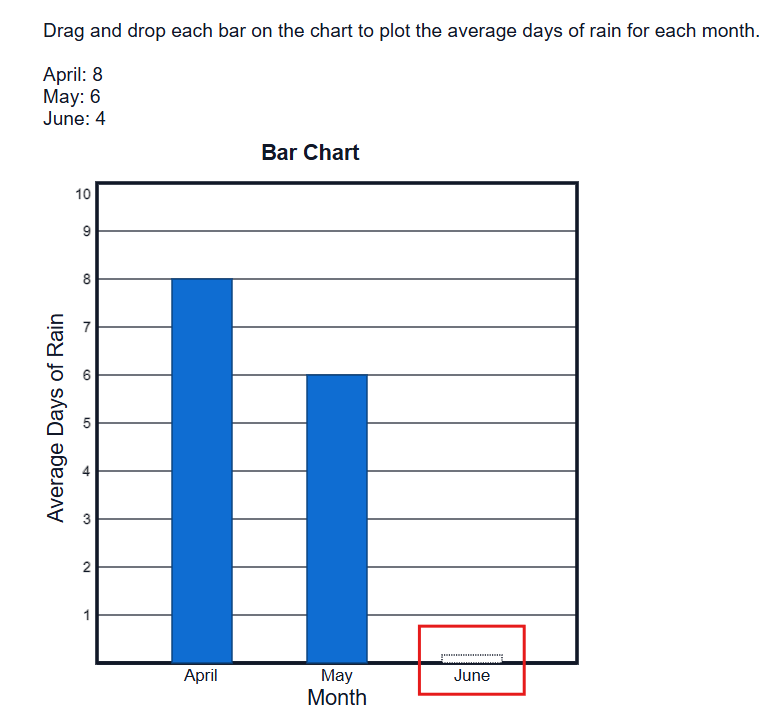
Sample Bar Chart interaction. To respond, the student can drag and drop the bar to the correct location.
Tiny Link: https://support.assessment.pearson.com/x/9YCbCQ