Graphing Interaction
In the Graphing interaction, the student responds by plotting points in a coordinate plane. Some settings enable the points to be connected by line segments or functions. Authors can add a prompt, set the graph type(s), grid coordinates, the axis min/max and labels, change the line settings as well as add pre-plotted points. Students can choose the graph type from the menu, add responses by clicking in the graph, moving points around and removing responses. This is a machine scored interaction.
See Author Test Items and Choice Interaction for general instructions on item creation.
Graphing Settings
Non-square grids are supported on the Graphing Interaction.
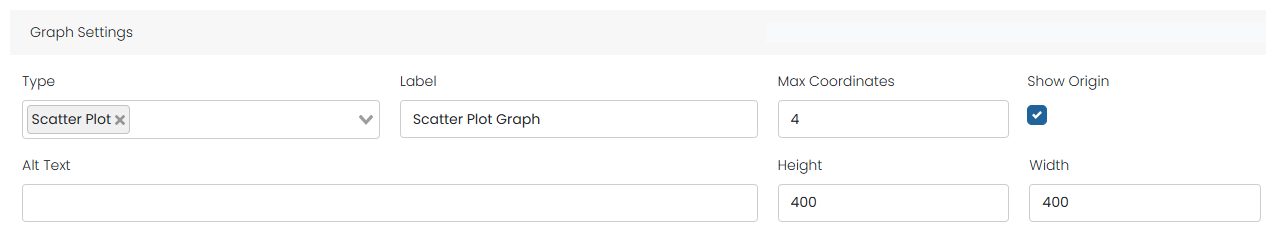
- Type: Choose from Absolute Value, Exponential, Linear, Polygon, Quadratic, Scatter Plot Solution Set, Logarithmic and Sine/Cosine.
- Label: Enter a label to appear above the grid.
- Max Coordinates: indicate the maximum number of points that may be plotted on the graph.
- Show Origin: Label the origin.
- Initial State: Checking this box will set default points on the graph for the student to move in order to add their response. A reset button is available to reset the graph back to initial state after any movement for points. (not available for all types)
- Solution Set Fill: Available if Type = Solution Set. If enabled, allows a region to be set as the correct response, instead of just a point.
- Alt Text: Any text here will be read by screen readers.
- Height/Width: Enter the dimensions of the graph, keeping in mind the size of the testing devices.
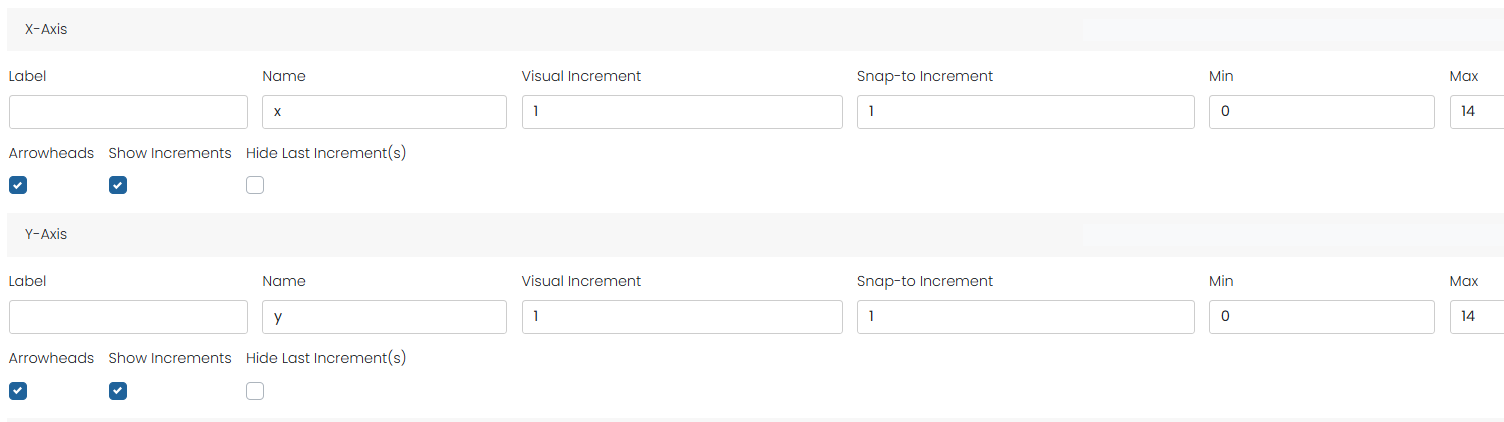
X-Axis and Y-Axis
The options for the X- and Y-axis are the same.
- Add a Label.
- Enter a Name.
- Visual Increment: Define increments for visual grid lines.
- Snap-to Increment: Define the snap-to positions where points can be placed. Points may be placed between visible grid intervals.
- Specify the Min and Max number.
- Arrowheads: Select to display an arrow at each end of the axis.
- Show Increments: These are typically enabled, but the labels may be hidden.
- Hide Last Increments(s): This is typically used when 'Arrowheads' is selected.
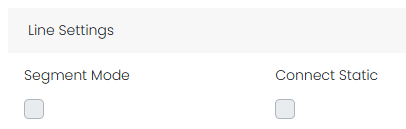
Line Settings
Segment Mode
- Connect Static: If you want the student to create a line to that static mark then you click connect static. When they click to respond it will make a line to connect.
Line Type
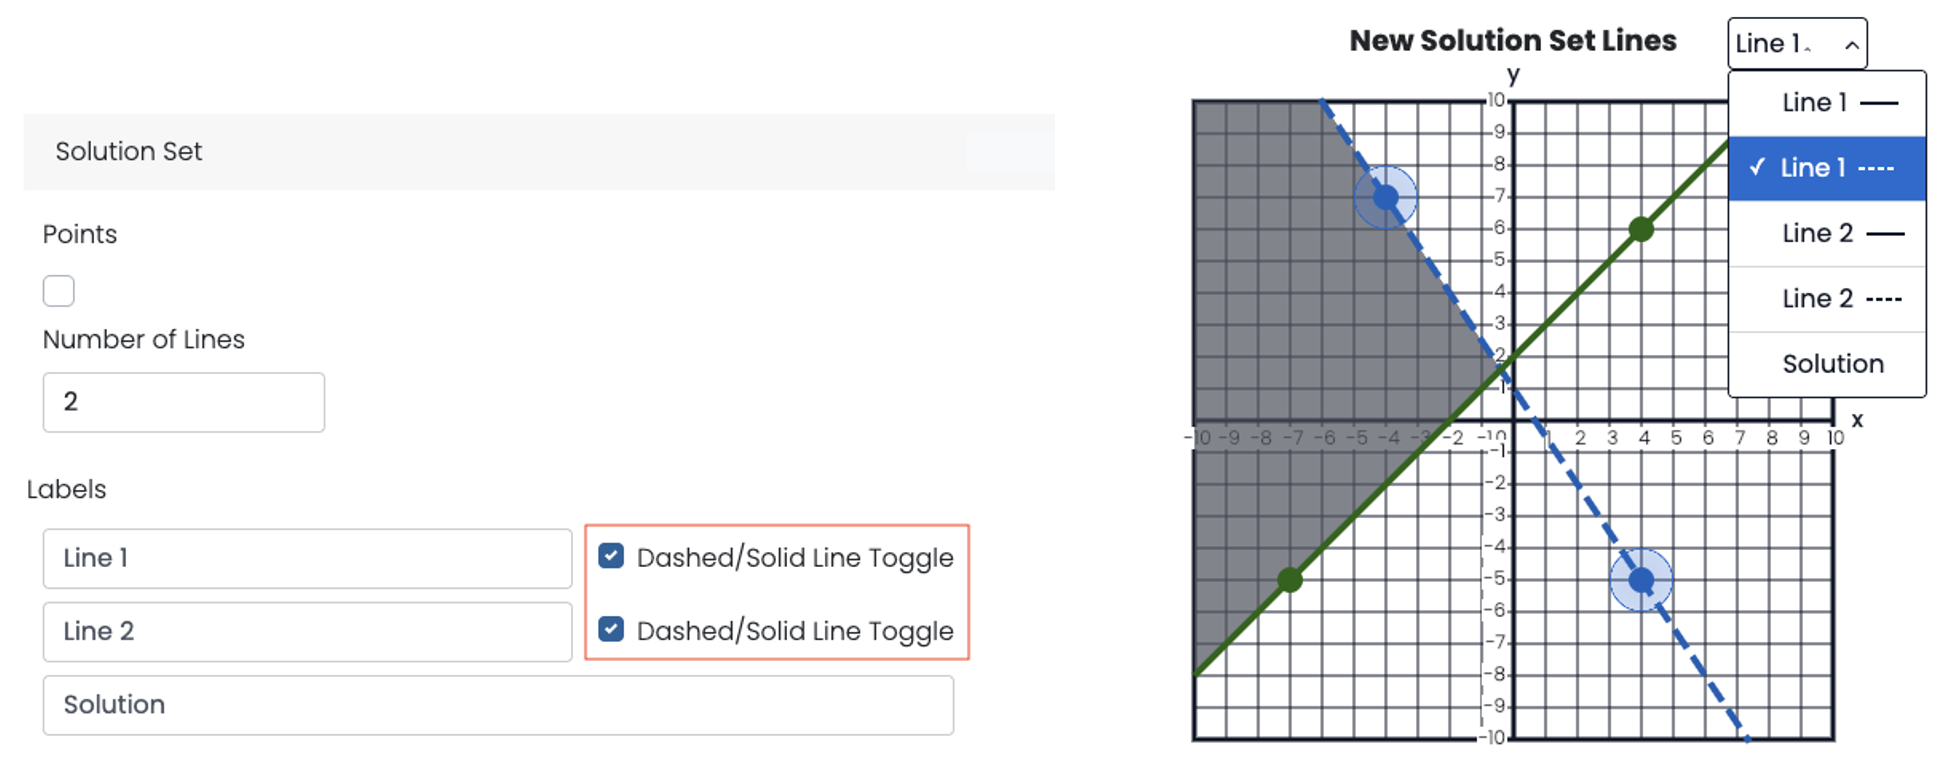
The line style toggle enables authors to select either solid or dashed lines for each line in the solution set. Authors can activate a toggle for each line, which updates the graph dropdown shown to students. Students will then be required to pick a line style as part of their response.
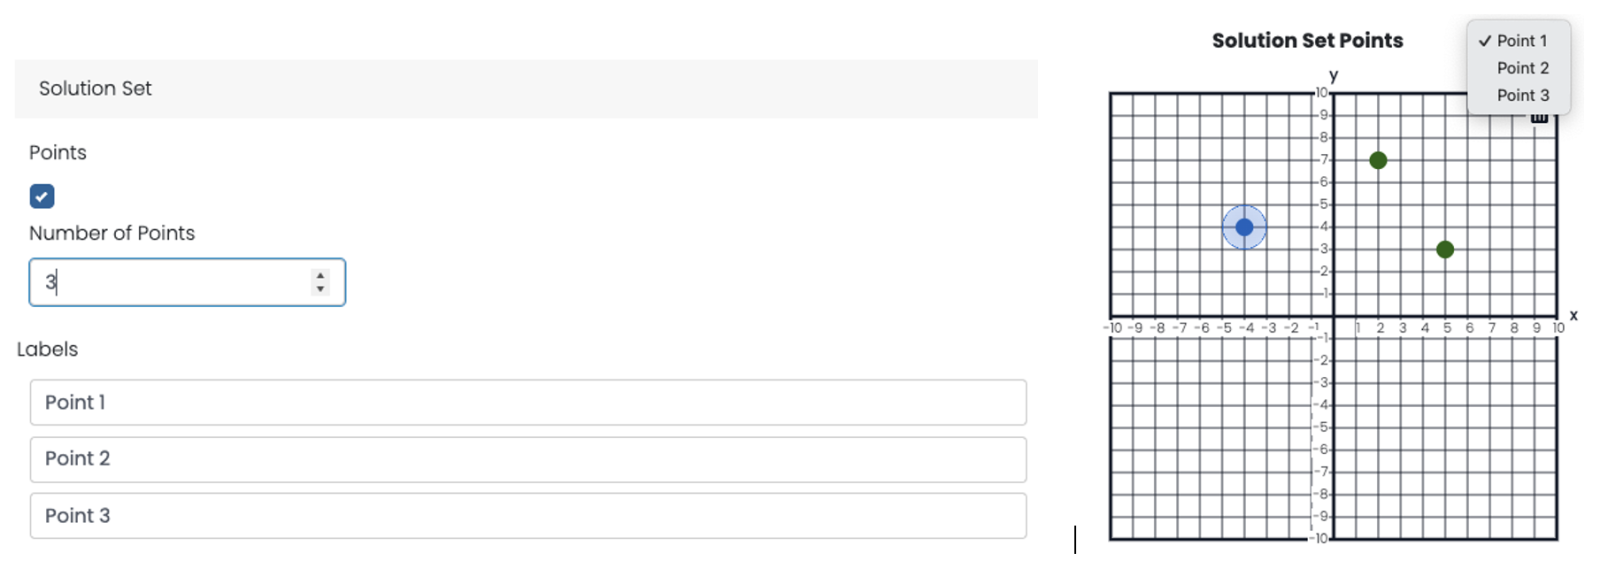
Points Only Mode
Authors can also enable Solution Set Graph interactions to work in a "points-only" mode where only individual points are plotted and scored. When the ‘Points’ checkbox is clicked, authors can set the number of plotted points and can label each point. This translates to the labels in the dropdown on the graph in preview mode and totals all points as a sum score.
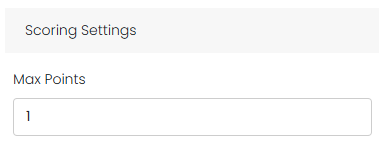
Score Settings
If scoring is required, enter a value in Max Points and be sure to plot the answer in the Correct Response Center.
Add Labels to Graph Types
Authors can add labels to graph types so the dropdown can display other terms or languages. The ‘Type Labels’ field appears on the Editor tab dynamically with the selected types. When a single type is selected the section will be hidden.
Display Origin Other than 0,0
You can show an origin that is not (0,0). Both origins will show if they are different values on the x and y axis, but only one shows if the value is the same.
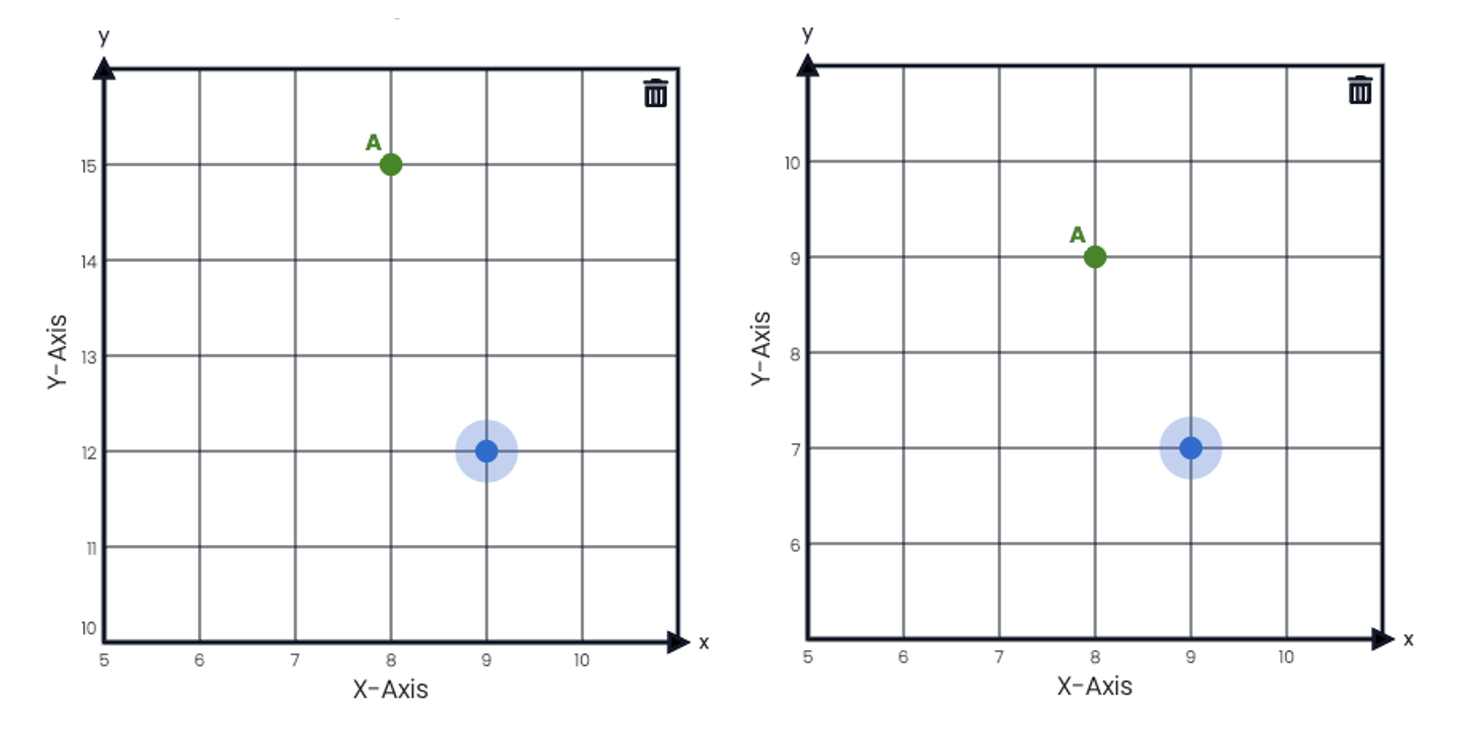
The sample on the left has two different origins; the sample on the right has the same value.
Quadratic Initial State Option
Authors can set an initial state of a quadratic graph that students can then drag in order to set their response. Initial state will always use coordinates (0,0) and (1,1). Students can reset their response to the original state by using the Reset button.
